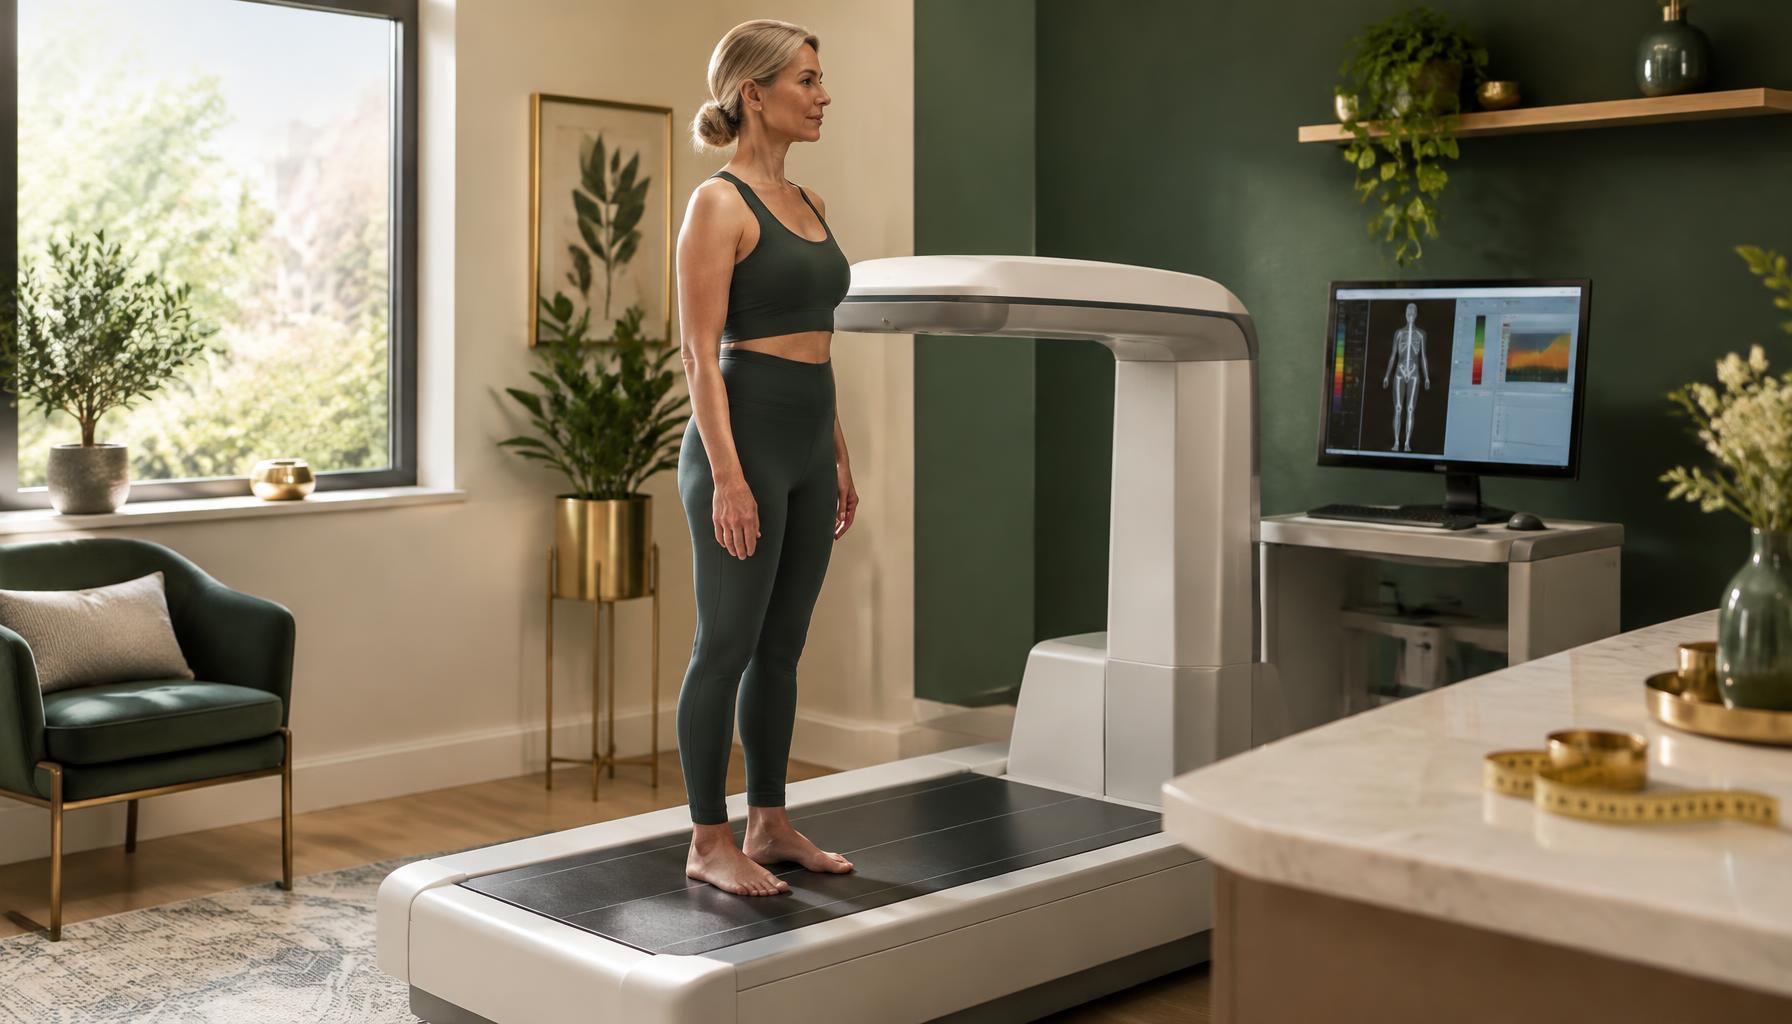
Menopause doesn't just add weight, it relocates it, and the timing is surprisingly precise. SWAN (Study of Women's Health Across the Nation) tracked 380 women with DEXA scans over a median 11.8 years and found visceral fat accumulation accelerated sharply during the menopause transition itself, jumping to roughly 6.2% growth per year, compared to essentially flat growth before it and a slower 1.5% afterward. Over the full study period, visceral fat rose about 32.5% in the referent group. Here's the part that catches people off guard: waist circumference, the measurement most people use to track this, grew steadily the whole time with no acceleration during the transition at all. The redistribution toward visceral fat is real and measurable on a scan. Your tape measure, and often your scale, largely misses it.
Why does menopause redistribute fat instead of just adding it?
Because estrogen does more than regulate reproduction, it also helps direct where your body preferentially stores fat. Premenopausal fat storage tends to favor subcutaneous depots (hips, thighs), the pattern often described as "pear-shaped." As estrogen production declines through the menopause transition, that directive weakens, and fat storage shifts toward the visceral compartment, the fat around and between abdominal organs, producing the more "apple-shaped" pattern common after menopause.
This isn't a passive side effect of aging in general. It's a specific hormonal mechanism tied to the transition itself, which is part of why the SWAN data shows visceral fat accelerating specifically during this window rather than gradually across the whole adult lifespan.
What does the actual timeline of this shift look like?
Sharper and more contained than most people expect. The SWAN body composition sub-study found visceral fat grew at a negligible rate before the menopause transition (around -1.85% annually in the referent group, essentially flat or slightly declining), then accelerated to roughly 6.24% per year during the transition itself, before settling to a slower 1.47% annually afterward.
A related SWAN analysis on overall body composition found the broader pattern: fat gain accelerated and lean mass began declining around 2 years before the final menstrual period, continuing until about 2 years after, then both trajectories flattened out. The transition itself, not the years before or the years well after, is where the most concentrated changes happen.
Why doesn't waist circumference pick this up?
This is the finding that should change how people track this. In the same SWAN analysis, waist circumference grew linearly across all three phases, before, during, and after the transition, at a steady 0.55-0.96% per year, with no acceleration during the transition despite visceral fat surging by over 6% annually during that same window. Total 12-year waist growth was about 7.6%, compared to visceral fat's 32.5% increase.
The researchers were direct about the implication: waist and hip circumference are "less sensitive to changes in fat distribution" than actual imaging. A person's waist measurement can look like it's changing at the same steady pace it always has, while the composition of what's underneath that measurement is shifting substantially toward visceral fat. The tape measure isn't wrong, exactly. It's just measuring something different from what's changing most.
Does this mean the scale is also unreliable here?
For tracking this specific shift, largely yes. Total body weight in the broader SWAN analysis increased steadily throughout the menopause transition without a dramatic acceleration, because the accelerated fat gain was being partly offset by simultaneous lean mass loss. Someone whose scale weight looks stable, or even improving, can still be in the middle of a real, accelerating shift toward visceral fat. Weight alone doesn't distinguish between losing muscle and gaining visceral fat versus maintaining a stable, healthy composition.
Does this pattern look the same for everyone?
No, and this is worth naming directly. The SWAN sub-study found meaningful differences by race and ethnicity: Black women in the study showed visceral fat decline in the postmenopausal period rather than continued accumulation, and Japanese women in the cohort showed no significant visceral fat gain during the transition at all. This is a real reminder that population-level findings describe a pattern, a common and clinically important one, not a universal rule that applies identically to every woman.
Why does visceral fat specifically matter, beyond appearance?
Visceral fat is metabolically active in a way subcutaneous fat generally isn't. It's more strongly associated with insulin resistance, elevated inflammatory markers, and cardiovascular risk than fat stored subcutaneously. That's the actual clinical reason this redistribution matters, not the cosmetic change in body shape, but the shift toward a fat depot with a meaningfully different metabolic profile.
This connects directly to something we've written about before: menopause as a metabolic event, not just a hormonal or reproductive one. Visceral fat redistribution is one of the concrete mechanisms behind that framing, not just a description.
How does this change how we approach this at Vitality Dartmouth?
Practically, it means we don't rely on the scale or a tape measure alone to judge whether someone's metabolic picture is changing during this window. Body composition testing and relevant labs give a much more accurate picture of what's actually happening than weight trends by themselves, particularly for a woman moving through the menopause transition specifically, when the SWAN data shows the most concentrated shift occurs.
It also means the training and nutrition approach during this window is built around preserving lean mass and addressing the metabolic picture directly, not just chasing a number on a scale that may not reflect what's actually changing underneath it.
Does this look different on the SouthCoast?
The biology is universal. What's different locally is whether anyone explains this mechanism at all, rather than treating a stable scale weight during menopause as automatically reassuring, or an increasing waist measurement as the full story.
We work with women across Dartmouth, New Bedford, Westport, Fairhaven, and Fall River who've been told their weight "looks fine" during this window without anyone checking what was actually happening to their body composition underneath that number.
Frequently asked questions
How long does this fat redistribution last?
SWAN data shows the sharpest acceleration is concentrated in the menopause transition itself, roughly the 2 years before through 2 years after the final menstrual period, with growth slowing considerably afterward, though not stopping entirely.
Can I prevent visceral fat redistribution at menopause?
The research reviewed here doesn't establish a way to fully prevent the hormonal mechanism driving this shift, but body composition, strength training, and metabolic health can all be actively managed through this window rather than left unaddressed.
If my weight hasn't changed, does that mean I'm fine?
Not necessarily. Total body weight can remain stable while lean mass declines and visceral fat increases simultaneously, since the two changes can roughly offset each other on a scale. Weight stability alone doesn't rule out meaningful composition change.
Is this the same as normal aging-related weight gain?
Related but distinct. General aging involves gradual changes over decades. The visceral fat acceleration described here is concentrated specifically in the menopause transition window, which is a hormonally driven, time-limited acceleration layered on top of any broader aging trend.
Want to know what's actually happening with your body composition?
If you've been tracking your weight or waist measurement through menopause and want to know what's really changing underneath those numbers, book a free discovery call. We'll go through real body composition data and labs, not just the scale.
This article is general health education and is not medical advice, a diagnosis, or a treatment recommendation for any individual. It does not create a clinician-patient relationship. Vitality Dartmouth is an RN-led clinic; all prescriptions and diagnostic orders are written by a collaborating nurse practitioner or physician. Individual results vary, and no outcome is promised or guaranteed. Talk with your own licensed healthcare provider about your specific health history, and call 911 for a medical emergency.
Sources
- Greendale, G.A., et al. Changes in Regional Fat Distribution and Anthropometric Measures Across the Menopause Transition. The Journal of Clinical Endocrinology & Metabolism, 2021. academic.oup.com
- Greendale, G.A., et al. Changes in body composition and weight during the menopause transition. JCI Insight, 2019. swanstudy.org