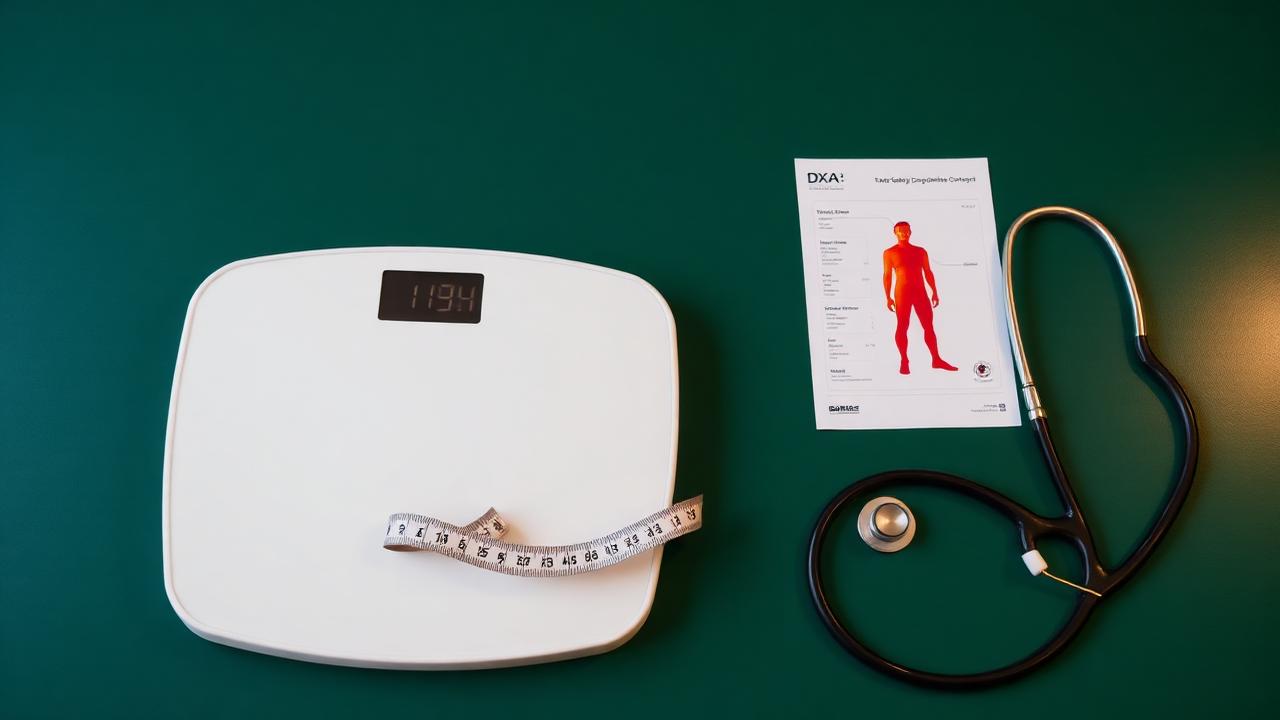
THE SHORT ANSWER: In perimenopause, body weight and body composition stop telling the same story. In the Study of Women's Health Across the Nation, a long-running NIH-funded cohort that tracked women through the transition with repeated DXA scans, the rate of weight gain did not accelerate when the menopause transition began. The rate of fat gain doubled, and lean mass declined at the same time. Those two changes roughly cancel on a bathroom scale. Separate analyses of the same cohort found visceral fat, the fat stored around the organs, went from a flat trajectory to rising about 6% per year once the transition started. So a woman can weigh what she weighed at 42 and carry a meaningfully different body at 48. The scale isn't broken. It's answering a question that stopped being the useful one.
What did the research find?
The SWAN body composition analysis followed women with serial dual-energy X-ray absorptiometry scans anchored to each woman's final menstrual period, which let the investigators separate what aging does from what the menopause transition does. Their finding was specific: fat mass and lean mass both climbed slowly before the transition. At the start of the transition, fat gain doubled its rate and lean mass began to fall. Both continued until about 2 years after the final period, then flattened out. Weight itself climbed in a straight line through premenopause with no visible acceleration at the transition (Greendale et al., JCI Insight, 2019).
A follow-up analysis looked at where the fat went. Android fat, the fat around the midsection, rose 1.21% per year during premenopause and 5.54% per year during the transition. Visceral fat began climbing only at the transition, at 6.24% per year. After menopause, both decelerated but never went back to zero. The authors also noted that waist and hip circumference were less sensitive to these changes than the imaging was (Greendale et al., Journal of Clinical Endocrinology & Metabolism, 2021).
Muscle loss over the same window is not aging alone either. A Finnish cohort followed women aged 47 to 55 from perimenopause into early postmenopause with DXA, CT, and muscle biopsies. Menopausal status independently predicted every measure of muscle mass they tested, including thigh muscle cross-sectional area. Physical activity was a separate, additional contributor (Juppi et al., Journal of Clinical Medicine, 2020).
Why does the same food and the same routine stop working?
Because the machine burning the food changes at the same time the food stays the same.
A 4-year longitudinal study measured this directly, using whole-room calorimetry, CT imaging, accelerometers, and food records in women who were premenopausal at baseline. Among the women who became postmenopausal during follow-up, sleeping energy expenditure dropped about 1.5 times faster than in the women who stayed premenopausal. Fat oxidation, the body's rate of burning fat for fuel, fell 32% in the women who transitioned and did not change in those who didn't. Physical activity dropped significantly about 2 years before the final period and stayed low (Lovejoy et al., International Journal of Obesity, 2008).
That's three separate things moving in the same direction: fewer calories burned at rest, less fat used as fuel, and less movement in daily life. None of them show up on a bathroom scale until they've been running for a while.
The 32% drop in fat oxidation is the part worth sitting with. It means the same meal is handled differently. Fuel that used to get burned is more available for storage, and the depot that takes it up preferentially in this window is the visceral one.
So the popular framing that "calories don't matter in perimenopause" isn't right either. Energy balance still holds. What changed is that both sides of the equation moved without anyone deciding to move them.
Who does this hit hardest?
Counterintuitively, often the women who look like they don't have a problem.
A 2026 analysis of 325 women stratified by BMI found the shift toward central fat was most pronounced in the normal-weight group. Visceral fat area went from roughly 36 to 48 to 56 cm² across pre-, peri-, and postmenopausal women in that category. In the women who already had obesity, the relative change was smaller (Szeliga et al., Journal of Clinical Medicine, 2026).
A woman at a stable, healthy weight can therefore accumulate the metabolically active fat depot while every number her primary care office records stays reassuring. She's told she's fine. Her clothes tell her something different. Both are true, because they're measuring different things.
What should be measured instead?
Four things, in rough order of how much they change the picture.
Body composition, not body weight. DXA is the reference standard and gives fat mass, lean mass, and a visceral fat estimate in one scan. A validated bioelectrical impedance device is a reasonable and more repeatable alternative for tracking direction over time. The SWAN regional-fat analysis noted specifically that waist and hip measurements underestimate the redistribution happening underneath, so a tape measure alone is not a substitute.
Fasting insulin, with glucose. Insulin drifts up years before fasting glucose or HbA1c move. A standard panel that reports glucose alone can look clean while insulin is doing the work of holding it there. This is the same argument covered in the post on why "normal" labs and optimal ranges aren't the same thing.
hs-CRP. High-sensitivity C-reactive protein tracks with visceral fat in this population, and rises in it correlate with rises in intra-abdominal fat independent of the fat sitting under the skin (Lee et al., Journal of Clinical Endocrinology & Metabolism, 2009).
Strength. A number that goes up. Grip strength, a 3-rep max, or the load on a leg press are all cheap, repeatable, and move in the opposite direction from the lean-mass trend described above. They also give a woman something to win at during a stretch where the scale offers no feedback worth having.
One note on hormone labs. A single FSH or estradiol draw in a woman who's still cycling is close to uninformative, because both swing widely across a perimenopausal cycle. The transition is identified from cycle history and symptom pattern first. That distinction is covered in more depth in perimenopause vs. menopause.
What does this change about how a program is built?
If the problem is fat up and muscle down at a stable weight, then a plan aimed at making the weight number fall can move the wrong variable. Aggressive calorie restriction without a strength stimulus and adequate protein pulls lean mass down alongside fat, which lowers resting energy expenditure further and makes the next phase harder.
The direction the research points is the opposite: keep the training stimulus high enough to defend muscle, keep protein high enough to use it, and judge progress on composition and function rather than a single morning number. Those specifics get their own post.
At Vitality Dartmouth, this is why our programs start with measurement rather than a meal plan. Genomic and biomarker testing is ordered by our collaborating nurse practitioner or physician. I build the program and coach the training around what the results show. That structure matters here, because the useful decisions in this window depend on data a bathroom scale can't produce.
Frequently asked questions
Does this mean weight doesn't matter at all?
No. It means weight alone is a low-resolution measure during a window when composition is changing faster than mass. Weight paired with a composition measure is far more informative than weight alone.
Is this only relevant after periods stop?
No. The SWAN trajectories show the acceleration begins at the start of the transition, which for many women is years before the final period. Perimenopause is the window where the changes are underway and the scale is quietest.
Can this be reversed, or only slowed?
Both fat mass and lean mass respond to training and nutrition input in postmenopausal women in randomized trials. Nobody can promise an individual result, and the evidence base describes group averages rather than guarantees. What the data supports is that the trajectory isn’t fixed.
Do I need a DXA scan to start?
No. A validated body composition device, a fasting insulin, and a strength baseline will show direction. A DXA adds precision, particularly for the visceral compartment.
Care in Dartmouth and the SouthCoast
Vitality Dartmouth provides in-person care in Dartmouth, MA, and works with women from New Bedford, Westport, Fairhaven, Fall River, and across the SouthCoast. If you've been told your labs are normal but your body has changed, a discovery call is a place to talk through what would be worth measuring. It's a conversation, not a clinical visit, and there's no scan or lab draw attached to it.
This article is educational and does not constitute medical advice, diagnosis, or a treatment recommendation. Vitality Dartmouth is an RN-led, physician-supervised clinic. Prescriptions and diagnostic orders are written by our collaborating nurse practitioner or physician. Talk with your own healthcare provider before making changes to your care.