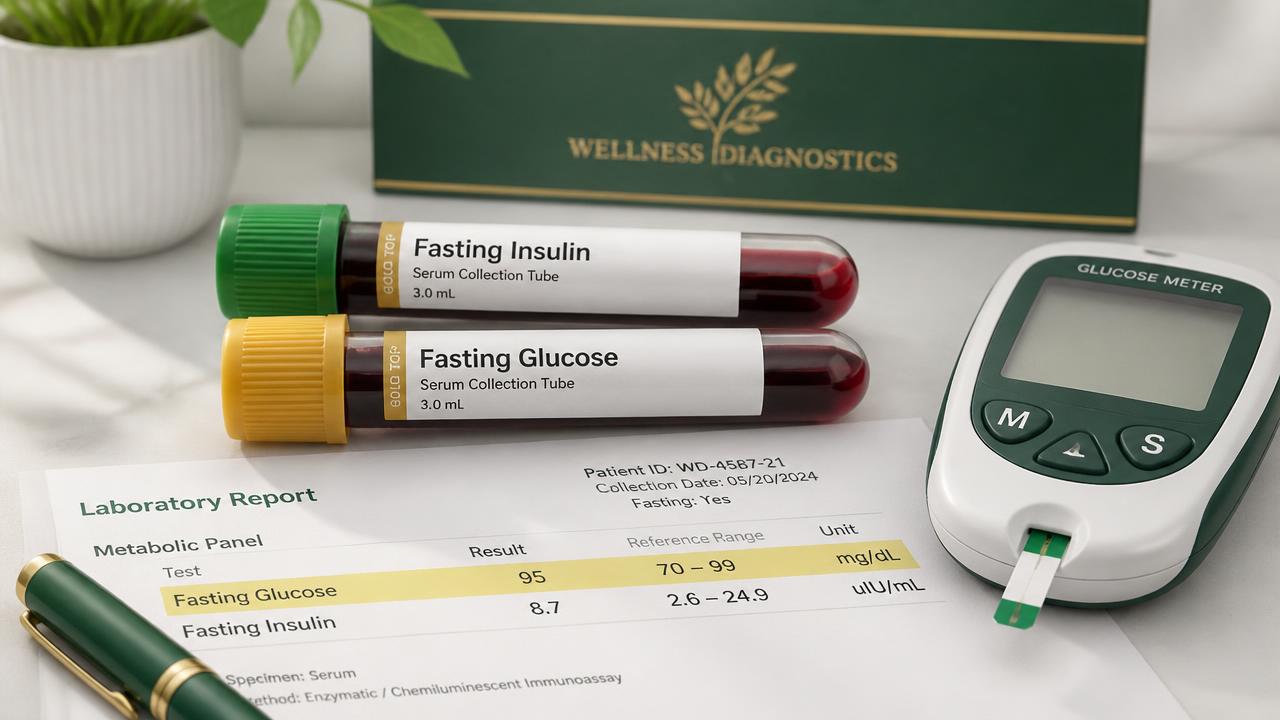
THE SHORT ANSWER: A standard fasting glucose or A1C test can come back "normal" for years before insulin resistance shows up as an actual diagnosis, because your pancreas can compensate by producing more insulin long before your blood sugar rises enough to cross a diagnostic threshold. That compensation is measurable with two additional, inexpensive tests, fasting insulin and the HOMA-IR calculation, that most standard panels don’t include unless you ask. Insulin resistance is also a well-documented driver of stubborn weight gain, particularly during perimenopause and menopause, which is why we test for it directly rather than waiting for glucose numbers to move.
What insulin resistance actually is
The National Institute of Diabetes and Digestive and Kidney Diseases (NIDDK) defines insulin resistance plainly: it’s "a condition in which your body doesn’t respond to insulin the way it should." Insulin’s job is to move glucose out of your bloodstream and into your cells for energy. When your cells stop responding efficiently, your pancreas compensates by producing more insulin to get the same job done. For a while, that compensation works: your glucose numbers stay in range, your A1C looks fine, and nothing on a standard panel flags a problem.
That’s the catch. The compensation itself is the early warning sign, and standard testing usually isn’t built to catch it.
Why "normal" glucose doesn’t rule it out
NIDDK’s own diagnostic ranges show how narrow the window is between normal and prediabetic:
- Normal A1C: below 5.7%
- Prediabetes: 5.7% to 6.4%
- Diabetes: 6.5% or higher
Someone can sit comfortably under 5.7% for years while their fasting insulin climbs steadily higher in the background, because A1C measures average blood sugar, not how hard your pancreas is working to keep it there. According to NIDDK, sustained insulin resistance is also closely tied to metabolic syndrome, a cluster that includes high blood pressure and increased waist circumference and raises your risk for heart disease, diabetes, and stroke. Age 35 and up, carrying excess weight, and having a family history of diabetes are all NIDDK-listed risk factors worth taking seriously even when your glucose panel looks unremarkable.
The two tests that actually catch it early
Fasting insulin. This measures how much insulin is circulating in your blood after an overnight fast. Reference ranges vary by lab and assay method, and there’s an important distinction here: the "normal" range most labs report is quite wide, while a tighter functional target, often cited around single digits (µIU/mL), is used by clinicians looking for early insulin resistance rather than just ruling out diabetes. That functional target isn’t an official diagnostic cutoff; it’s a lower bar clinicians use to catch the problem years before it becomes a diagnosis.
HOMA-IR (Homeostatic Model Assessment of Insulin Resistance). This is a calculation, not a separate blood draw. It combines your fasting glucose and fasting insulin into a single score: HOMA-IR = (fasting glucose × fasting insulin) ÷ 405. Commonly cited interpretation bands look roughly like this:
- Below 1.0: often considered optimal insulin sensitivity
- 1.0 to 1.9: generally within normal range
- 2.0 to 2.9: early insulin resistance signal
- 3.0 and above: significant insulin resistance
Those thresholds vary by population, lab, and the research they’re drawn from, so this isn’t a single universal cutoff. The pattern matters more than any one number: a HOMA-IR trending upward over time, even while it’s still "in range," is useful information a standard panel alone won’t surface.
Why this matters more during perimenopause and menopause
Insulin sensitivity tends to decline as estrogen drops during the menopause transition, which is part of why a lot of women notice weight gain, especially around the midsection, that doesn’t respond to the diet and exercise approach that used to work. This is a physiological shift, not a discipline problem, and it’s one of the reasons insulin resistance testing is a standard part of how we evaluate weight-loss resistance in perimenopausal and menopausal clients, alongside hormone status.
How we test for this at Vitality Dartmouth
This is exactly the kind of thing standard annual bloodwork is prone to miss, which is why it’s built into our process rather than treated as an add-on:
- Fasting insulin and HOMA-IR are part of our standard lab panel, not something you have to ask for separately, through the same genomic and lab testing process every new client goes through.
- We look at trends, not just single "in range" results. A HOMA-IR moving from 0.9 to 1.8 over a year is worth a conversation even if both numbers technically pass.
- Insulin resistance findings shape the whole plan, including nutrition timing, training approach, and whether a GLP-1-class medication or other intervention makes sense, through our coaching programs, not just a single number in isolation.
- We’re specific about what’s a lab reference range versus a functional target. You’ll hear the difference explained plainly, not blurred together to make a sales case.
Frequently asked questions
Can I have insulin resistance with completely normal blood sugar?
Yes, this is the core issue this article describes. Your pancreas can compensate with extra insulin for years before glucose numbers move, which is exactly why fasting insulin and HOMA-IR are useful in addition to, not instead of, standard glucose testing.
Is HOMA-IR a diagnostic test?
It's a calculated index used clinically and in research to estimate insulin resistance, not a single FDA-cleared diagnostic test with one universal cutoff. It's most useful as a trend marker over time, interpreted alongside your full history and other labs.
Does insulin resistance cause weight gain, or does weight gain cause insulin resistance?
Current understanding is that the relationship runs both directions and reinforces itself. Excess weight (particularly visceral fat) contributes to insulin resistance, and insulin resistance makes further weight gain and fat loss resistance more likely. That's part of why testing for it directly, rather than assuming it from weight alone, matters.
Do you test for this near me?
Yes. Vitality Dartmouth is based in Dartmouth, MA and works with clients across the SouthCoast, including New Bedford, Westport, Fairhaven, and Fall River, with RN-supervised lab testing and interpretation.
The bottom line
A "normal" glucose panel is reassuring, but it isn’t the full picture. Insulin resistance can build for years underneath normal-looking numbers, particularly through the menopause transition. Fasting insulin and HOMA-IR give you an earlier, more complete view, and knowing where you actually stand is the starting point for any plan that’s supposed to work with your metabolism instead of against it.
This article is for educational purposes only and is not medical advice. Reference ranges and interpretation cutoffs discussed here vary by laboratory, assay method, and population, and are not universal diagnostic standards. Insulin resistance and related conditions should be evaluated and managed by a licensed healthcare provider based on your complete history and labs. Individual results vary.